The one with the one VM
The main server in the rack ran Proxmox, and Proxmox’s entire job was to run one virtual machine. That VM was the Kubernetes node for all my nodes.
On 3 October I deleted it and installed NixOS on the bare metal instead.
Three reasons, and the big one is that I could no longer answer simple questions about my own machine. Which units are running on it? Which of them did I install by hand at some point, from a script I wrote once and never ran again? The repo has 52 install-*.nu scripts in it, and that machine alone carried around 30 host-level units that existed only because a past version of me had SSH’d in and set them up. Half of them I could not have described from memory.
The clearest example was waiting for me two days into this. The VPN config on that box carried a NAT rule masquerading out of ens19 — the VM’s virtual network card. On bare metal there is no ens19, so every NAT rule silently failed, and a client would have got a tunnel that carried nothing. While I was in there I found that the file being served was a wireguard-ui export from July 2024 with ten obsolete peers in it. Unit active, port bound, packets arriving, zero handshakes. I wrote that config, I forgot about it, and nothing in the system had an opinion about whether it was still true.
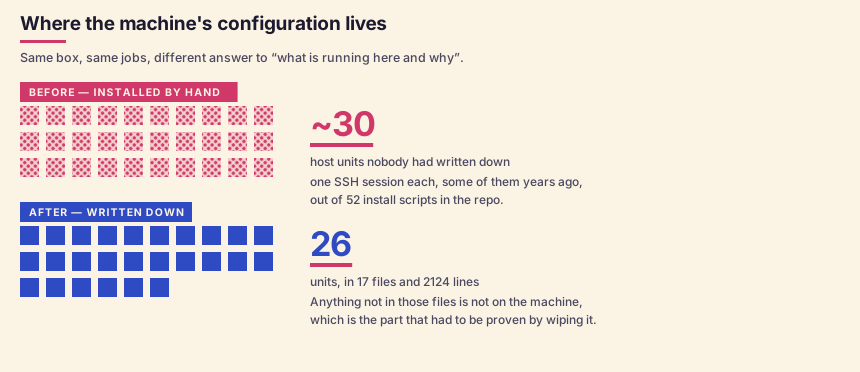
NixOS is one file per machine. Everything the box does is in it, and anything not in it is not on the box. That is the whole pitch, and the only way to find out whether it holds is to wipe the thing.
The other two are plainer. The VM was handed 49 GiB of the machine’s 62 whether it used them or not, and I wanted that memory back. And one box running one hypervisor running one VM is two operating systems to patch, two sets of network config, two places for a mount to go wrong — for no benefit I could still name.
The reinstall took six hours and seventeen minutes, and nobody noticed
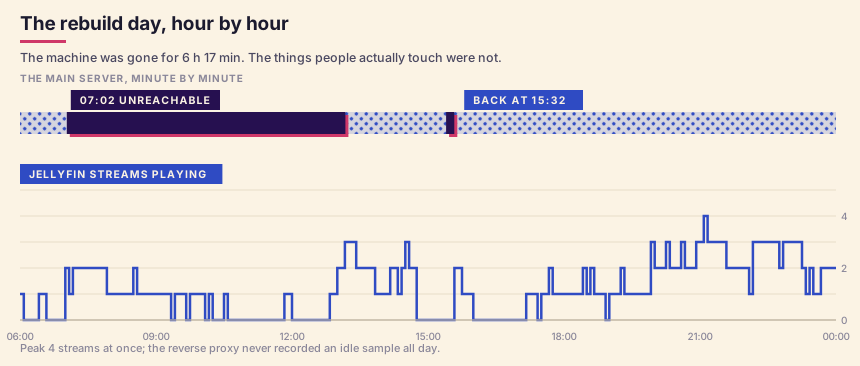
377 of 1440 minutes on 3 October with the machine unreachable. The week before it had one down minute, and since the final boot it has had one more in seventeen hours.
No services stopped answering during those six hours. The reverse proxy never recorded a zero-traffic sample; Jellyfin and the databases moved to the two standby nodes and served from there, which is what the whole storage-replication project earlier this year was for. The parts that did stop were the ones only that machine does.
This is the bit I actually enjoyed. I formatted the main server in my rack on a Saturday while Jellyfin reported one to three active streams through the whole window, and the worst consequence was that a backup window moved. Homelab tinkering with the stress taken out of it is a different hobby than the one I had in May.
Trouble with the network card and nixos
Powered on, management controller healthy, no hardware event logged, nothing on the serial console, unreachable until a hard reset. For months, in the VM, this had been written down as an unexplained kernel hang. It is not a hang — the kernel stays alive, the journal keeps being written, and only the network card dies. The etcd and apiserver timeouts that used to look like the cause all happen after the carrier drops.
The persistent journal, which the two earlier investigations did not have, shows every firmware fault preceded in the same second by an IOMMU page fault raised by that same card:
AMD-Vi: Event logged [IO_PAGE_FAULT domain=0x0016 address=0x9f083000 ...]
bnxt_en 0000:0b:00.0 eth2: Abandoning msg ... firmware status: 0x2000001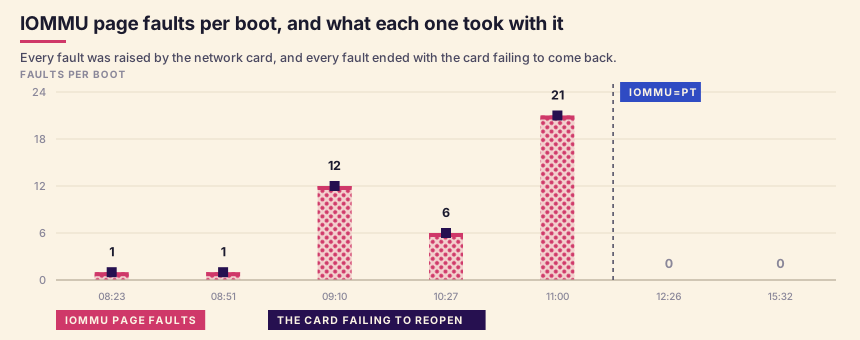
Across the five boots before I understood it: 41 page faults, every one of them raised by the network card, and 41 failed attempts to bring the card back up. One to one, boot after boot. The fix is a kernel parameter, iommu=pt, which gives host-owned devices an identity mapping instead of a translated one. The two boots since have logged none of either, seventeen hours and counting.
Two usual suspects were measured and thrown away first (although that was emotionally hard to accept): disabling TSO/GSO/GRO changed nothing, and pinning the 6.12 LTS kernel made it worse — 808 firmware lines in 33 minutes against 408 in 20 minutes on 6.18. Under Proxmox the guest reached the network over a virtual NIC, so the host driver never drove this card’s DMA. Bare metal did.
Four things stopped existing and only the monitoring noticed
The NFS watchdog, the UPS guard that shuts the box down when the battery is going, a mount, the multicast relay. All four were installed on the old machine rather than described in a file, so when the disk was wiped they were gone, and a fresh OS has no idea they ever existed.
On Fedora those scripts had drifted for years and nothing would have told me. Here each gap was a red check within minutes of the box coming back.
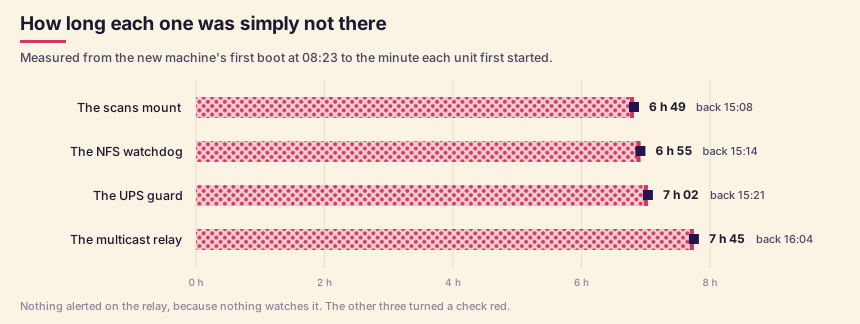
The relay is the one worth naming. It carries AirPlay and media discovery between the normal network and the IoT network, it has no health check of its own, and it was dead from the rebuild until yesterday evening. Nobody mentioned it, which is its own data point.
Two operating systems were accounting for the same 62 GiB
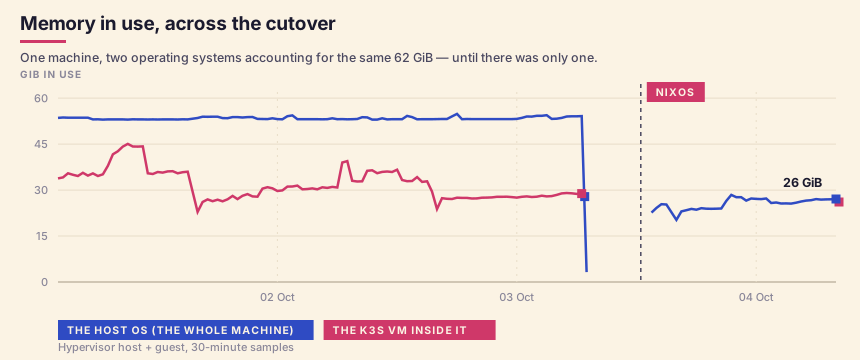
Before, the host reported a median 53 GiB in use and the VM inside it reported 34 — the same physical memory, counted by two kernels, with the guest’s allocation pinned whether it used it or not. Since the cutover one OS reports 26 GiB. Only ~1.2 GiB of that gap is genuine virtualization overhead, but what the machine can hand to a container is a different number than it was.
CPU went down and up at the same time
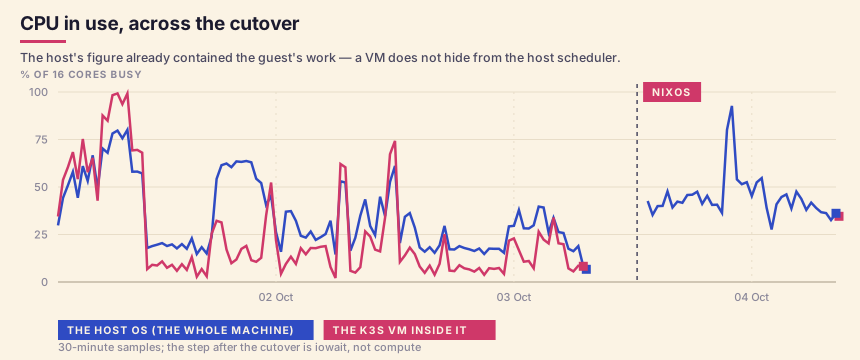
The two lines here are not additive the way the memory ones are: a guest does not hide from the host scheduler, so the host’s figure already contained the VM’s work. Median busy across the window was 29% before and 42% after, which looks like the wrong direction until you split it by what the cores were doing. User time — actual compute — went from 14.1% to 6.4%. Waiting on disk went from 0.8% to 26.6%.
That iowait is one job: the first full backup of the config tier, which has now been running for sixteen hours and does not repeat. Underneath it the machine is doing the same work with less than half the CPU it used to take. I guess I just need to be patient and measure again once it has all settled.
What it cost
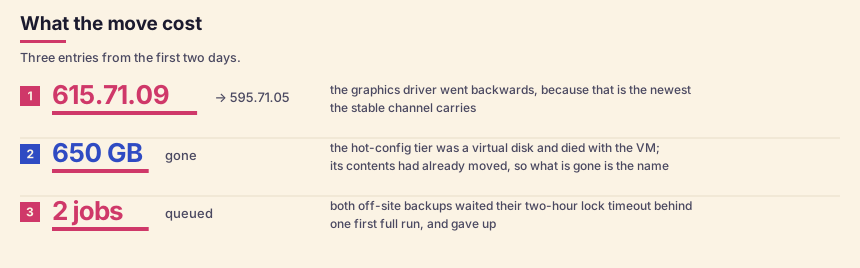
The NVIDIA driver went backwards, 615.71.09 to 595.71.05, because that is the newest the stable channel carries. The 650 GB hot-config tier was a virtual disk and died with the VM; its contents had already moved to replicated storage, so what is actually gone is the name.
Right now two units on that box are red, both for the same reason: that first full backup holds the lock that keeps the heavy NFS jobs from running at once, and the two off-site jobs behind it each waited their full two hours and gave up. All three are correct, they are just serialised behind a run that only happens after a rebuild.
The machine is 17 files and 2124 lines now, declaring 26 units. Next up are the other three boxes in the rack, which are still exactly the kind of machine this one used to be.